 Introduction
Due to economic growth, the number of the cars used has increased in the resent years. This accompanies the degradation of air quality, especially in industrialized countries and urban environments due to traffic congestion [1]. In many areas, the traffic related air pollution is the main reason of air quality degradation. The pollutant concentrations are related directly with the duration of the congestion [2]. The World Health Organization (2010)[3] has set the maximum values of pollutant concentrations but in many measurements, these values are exceeded[4].
The concept
The concept is to build a low-cost, low power consuming device to monitor the quality of air.
This project is based on Arduino [5] platform. A dust sensor [6] and a temperature-humidity sensor [7] are used.
The idea
The main idea of this project is to monitor the urban air quality with low cost and low energy consuming devices in order to have a good view of PM trends and/or trace gases. Many sensors could be placed around the spot we would like to monitor and send data to a central computer which could show real time spatial air pollution data.
Aside the two sensors used, CO, CO2, NOx, SOx, etc. sensors can be added to have a better view of the air quality but this is not currently needed.
At this point, the project aims to find if these sensors and especially the dust sensor can measure what the company says it can (concentration of particles over 1μm in diameter).
The temperature-humidity sensor
The sensor used to measure temperature and humidity is an easy to use sensor. It measures temperature with an accuracy of ±2oC and humidity with ±5% accuracy [8]. The accyracy is good for this project because we want to see the trends and we are not interested so much for the error.
The Dust Sensor
The sensor that is used here is a Grove Dust Sensor. As it described on the Shiney’s (the manufacturer) site, the main idea is this [9]:
Heater (resistor) generating updraft. Infrared light beam from LED has been focused with Lens to sensing point at the center.
Airborne particles have been taken into the sensor box with the updraft.
Particle passing through sensing point scatters light and receptor receive scattered light through the lens and transformed into pulse signal. Pulse per unit time is proportional to the particle concentration. Pulse signal are to be converted into voltage output. (PPD20V)
The assembly of the sensor is described in detail on Tracy Allen’s pdf [10].
Another alternative sensor (that it is not used here) is the Sharp Optical Dust Sensor [11] and it is based on the same operation principles. This sensor is used in other projects found on the web [12], [13].
Due to the fact that urban aerosols are anthropogenic and mainly from combustion they can be described as fine particulate matter [14], speaking in size terms and this sensor is not recommended if the goal is to measure the concentration of pollutants with accuracy. The use of this sensor should be only if the user wants to have a view of to concentration trends.
The urban aerosol number size distribution is described in Hussein et. al. (2004) paper [17] where it can be seen clearly that speaking in number concentration terms, urban aerosols are mainly sized below 1μm.
Assembling
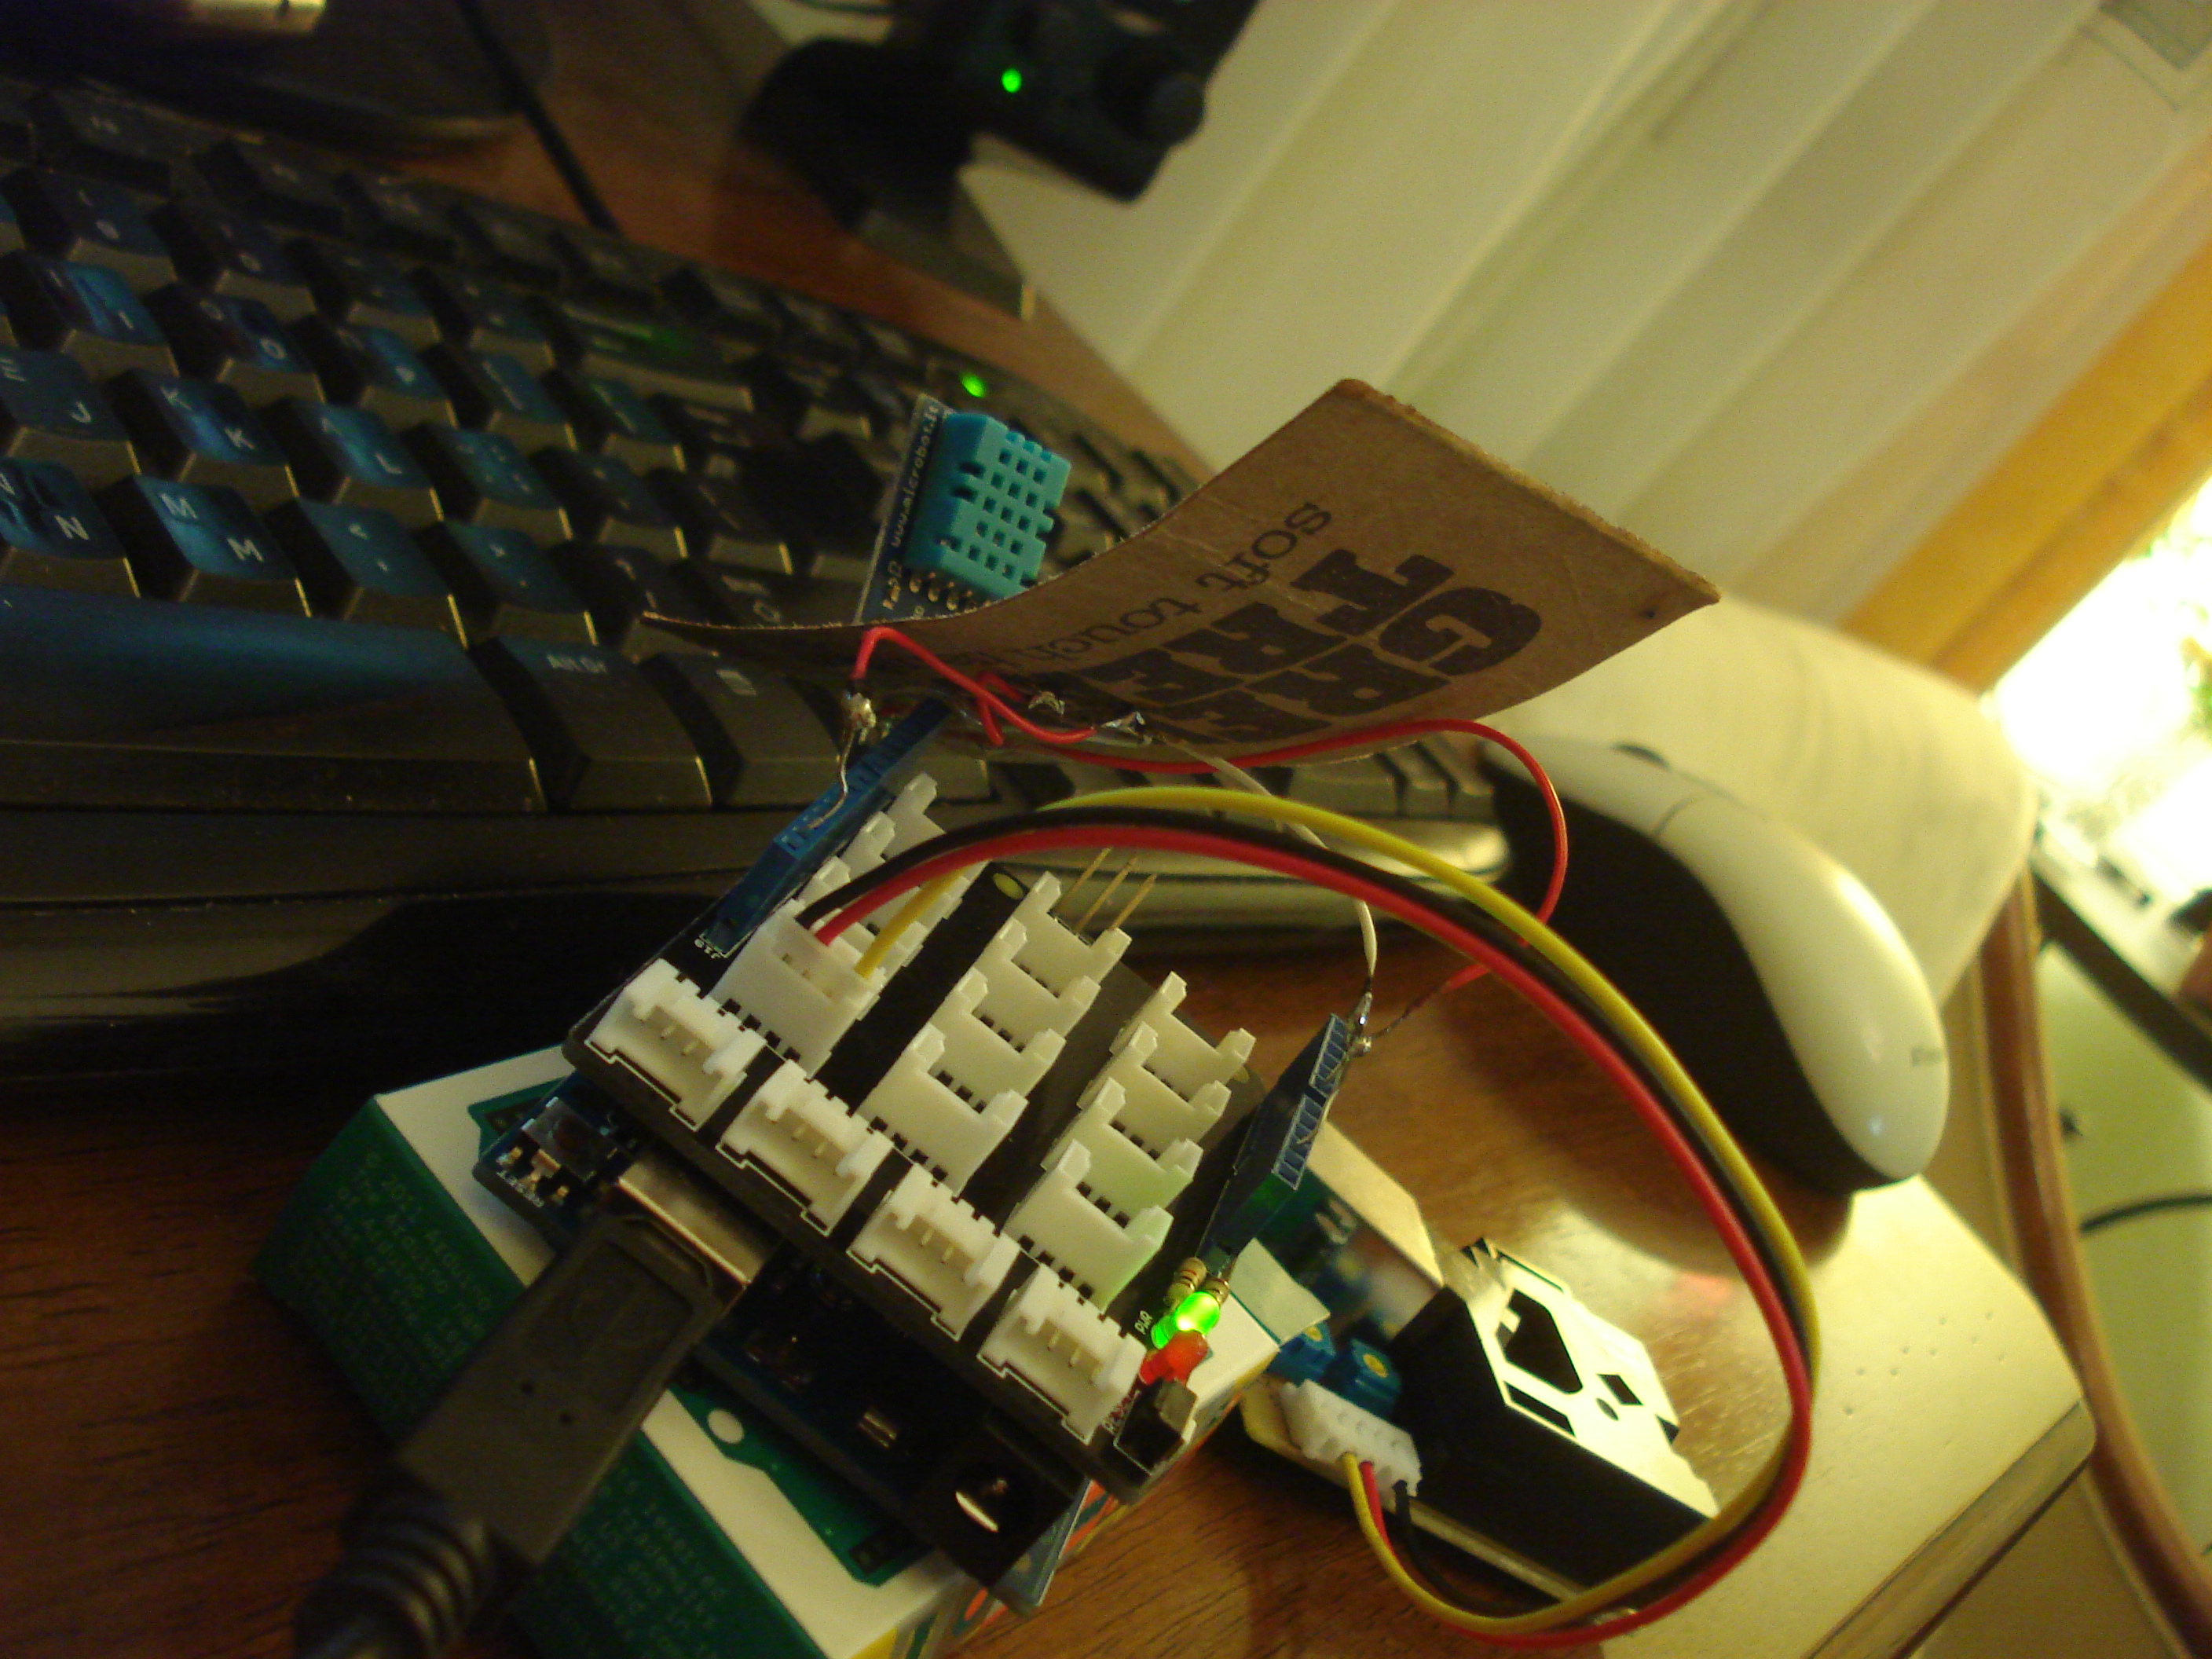
In this project, beside the two sensors mentioned above, the core is an Arduino board (Arduino Uno rev.3) and a Grove Base Shield (v. 1.3). The following images show the way that the sensors are connected and packed together.
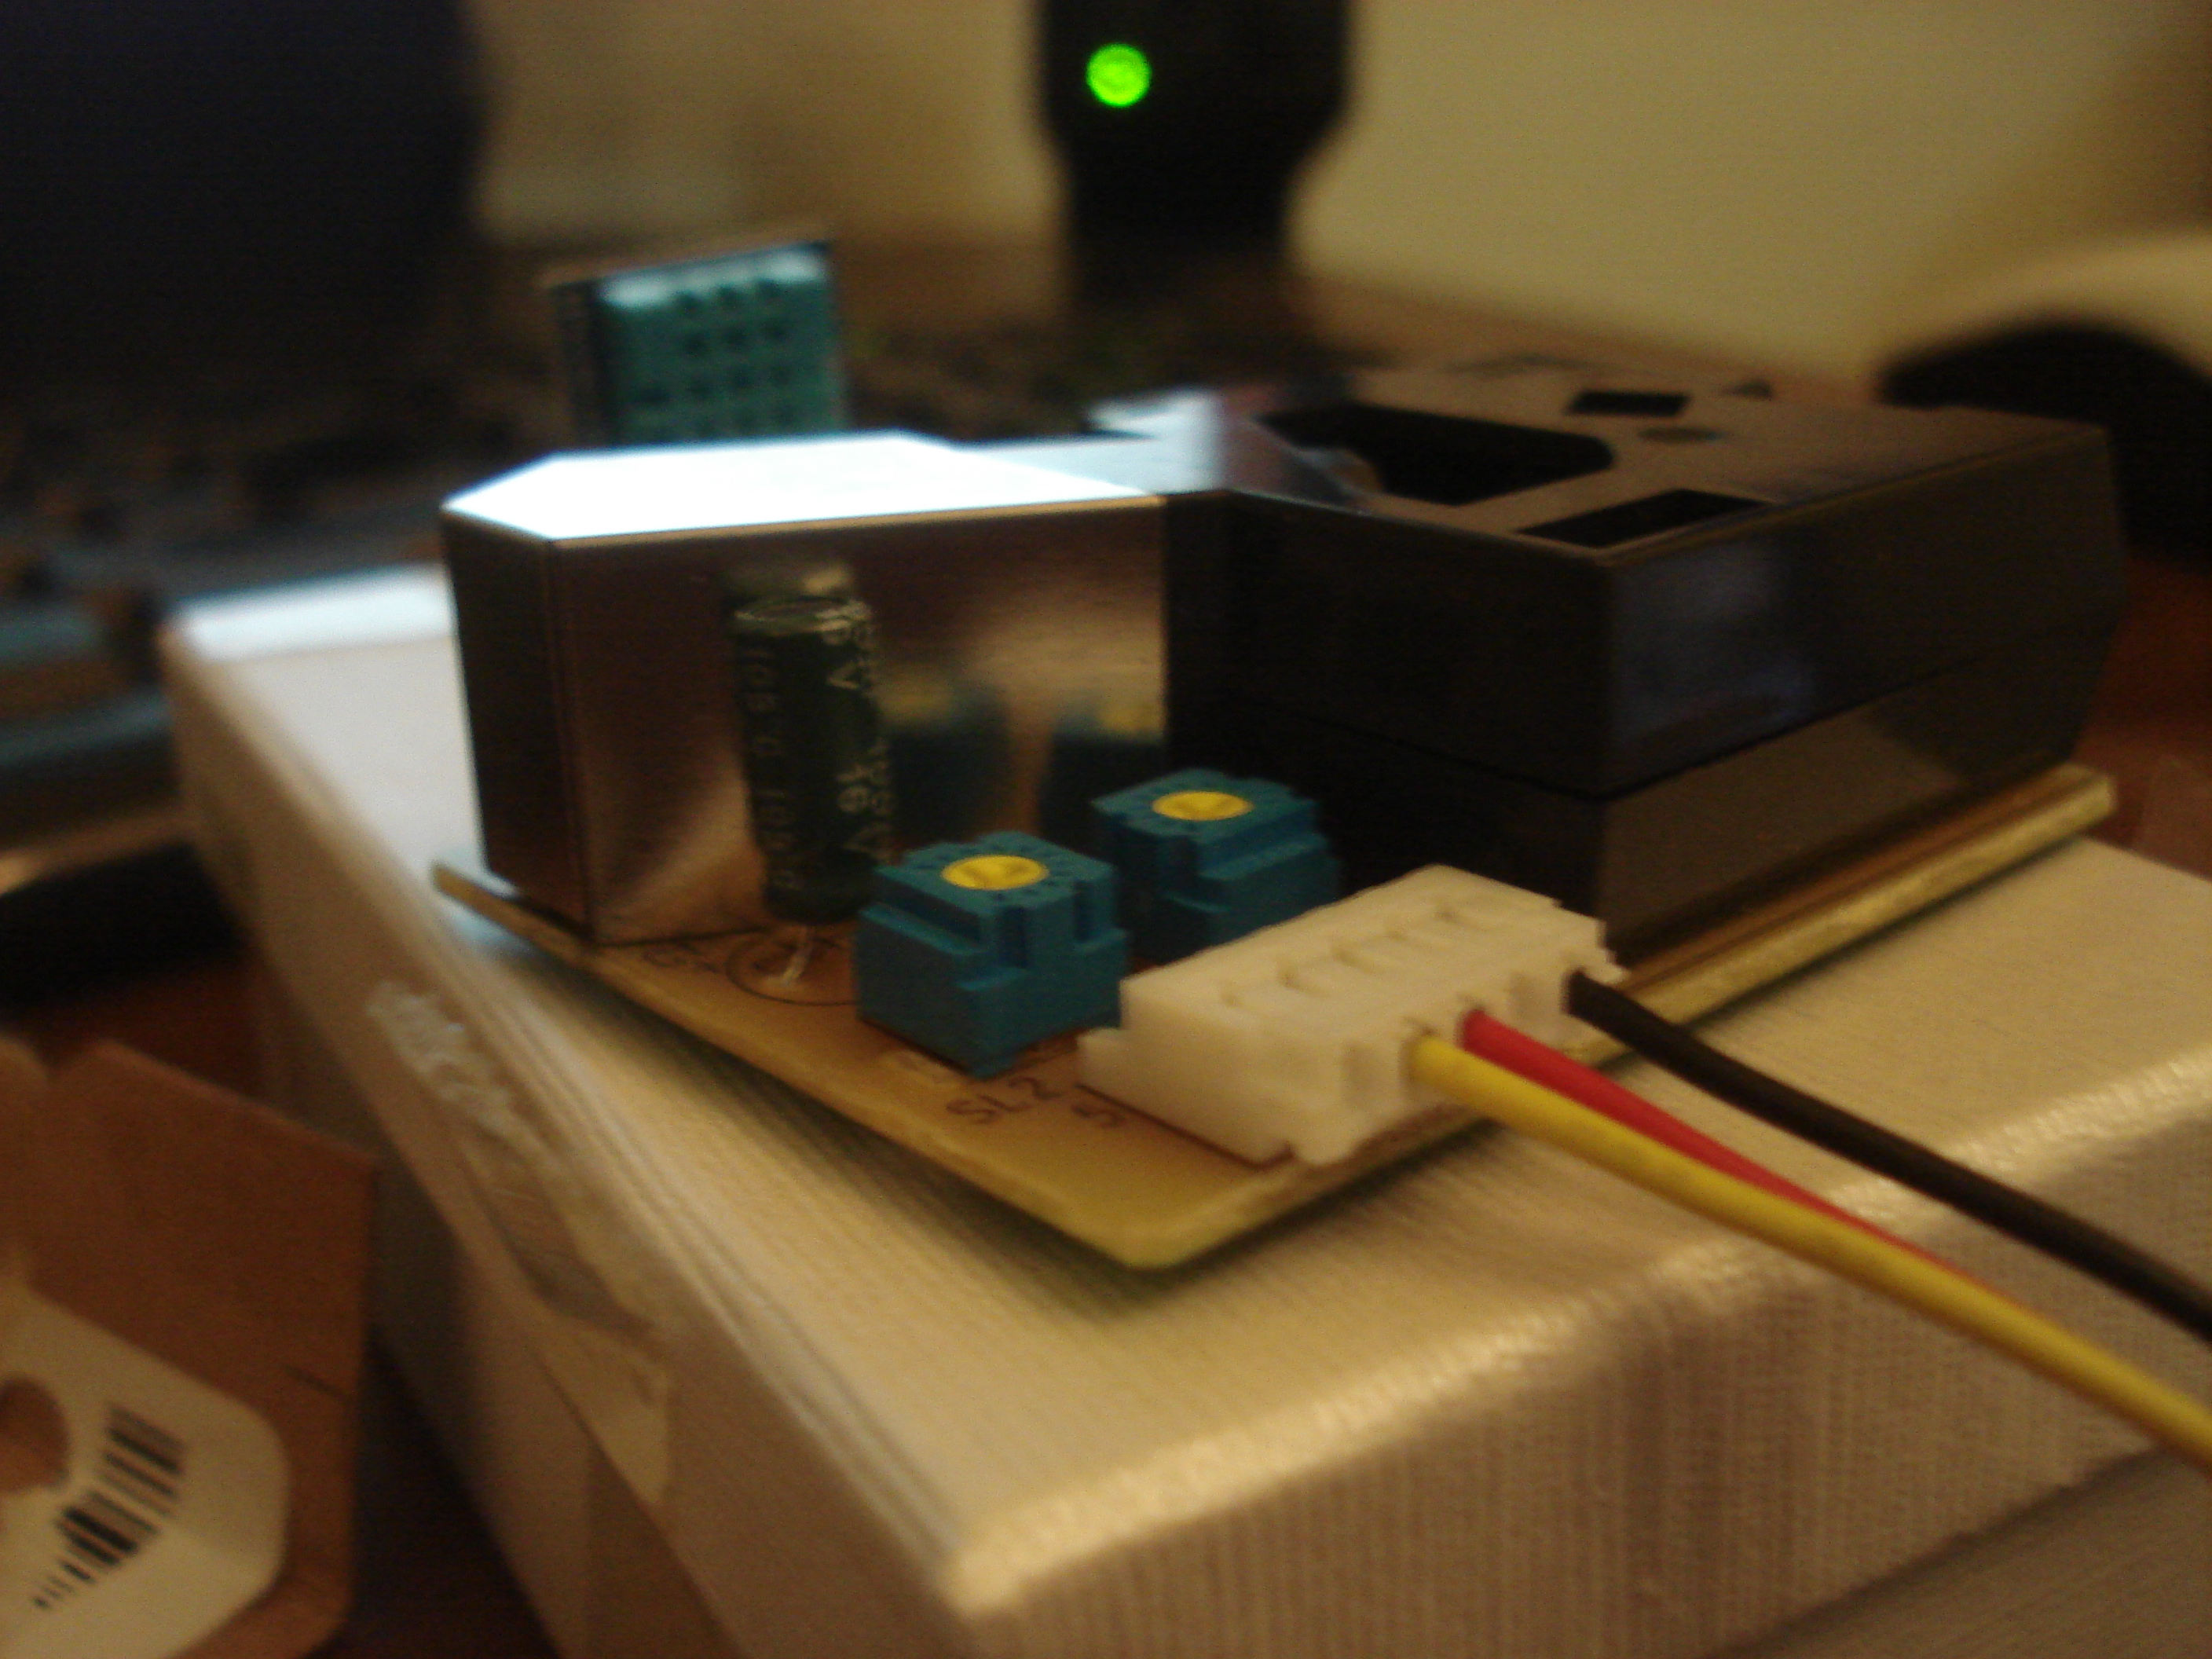 dust sensor on the arduino box (uncovered)
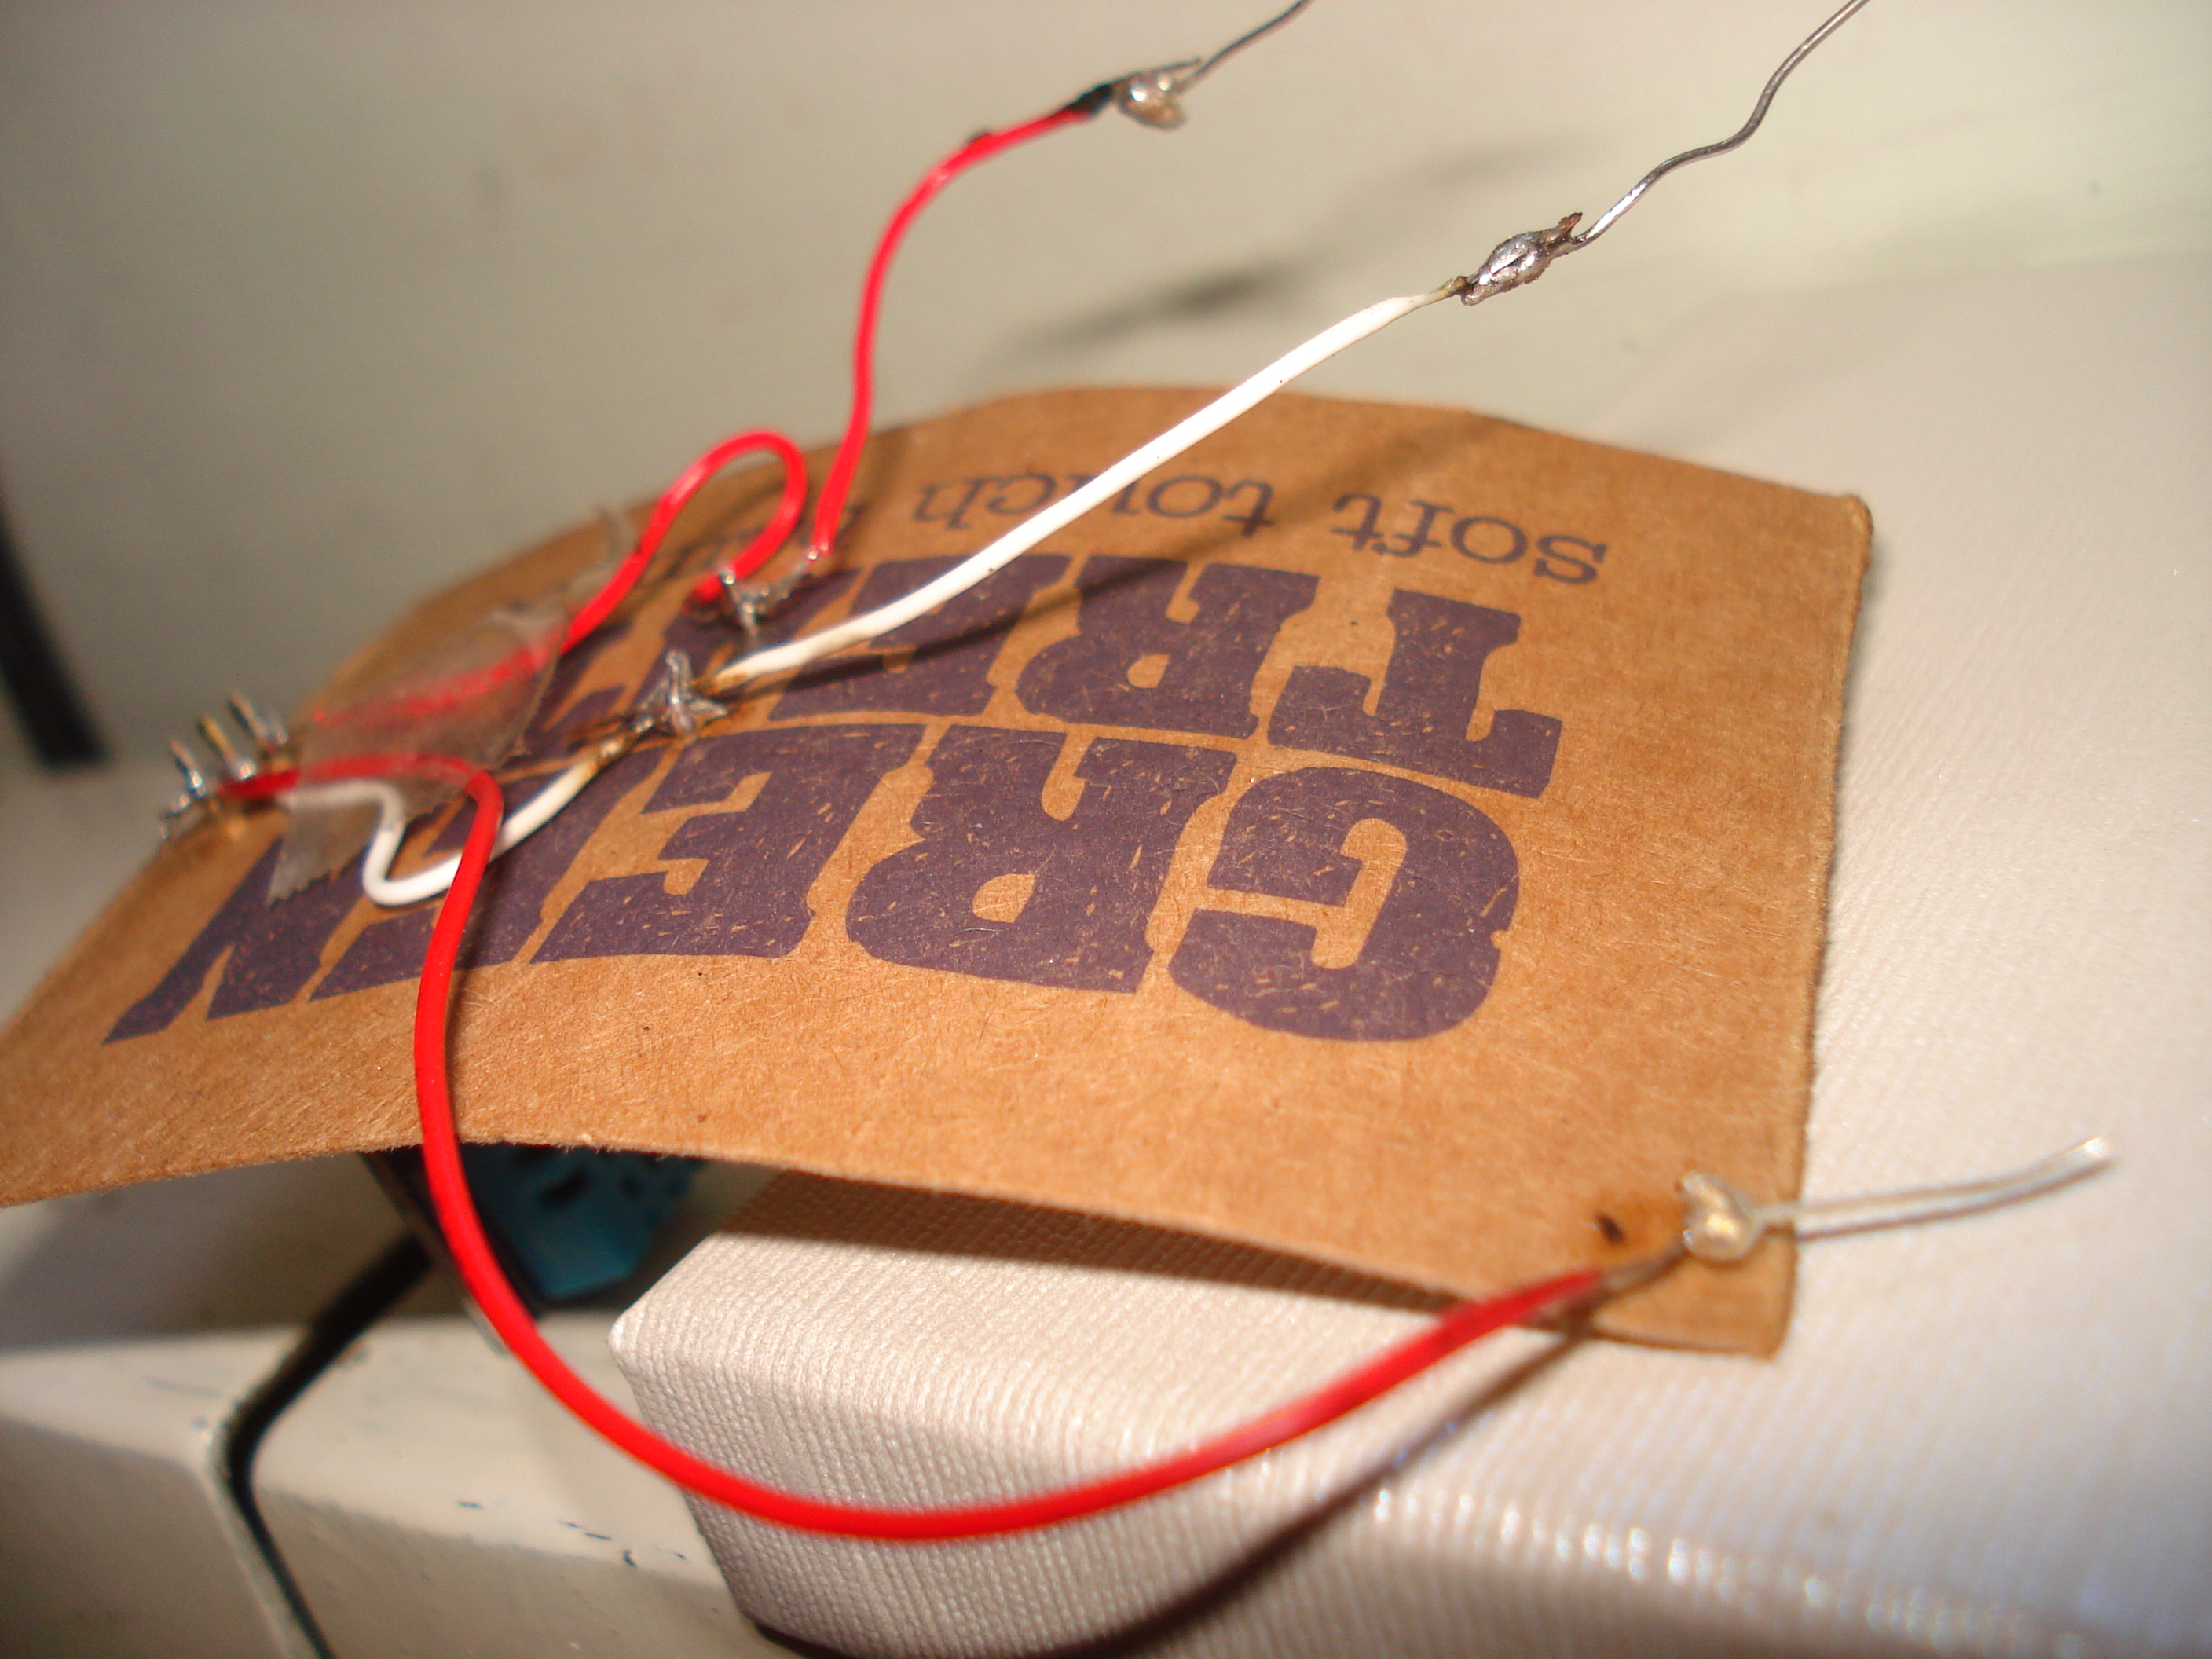 the HDT11 sensor soldered
 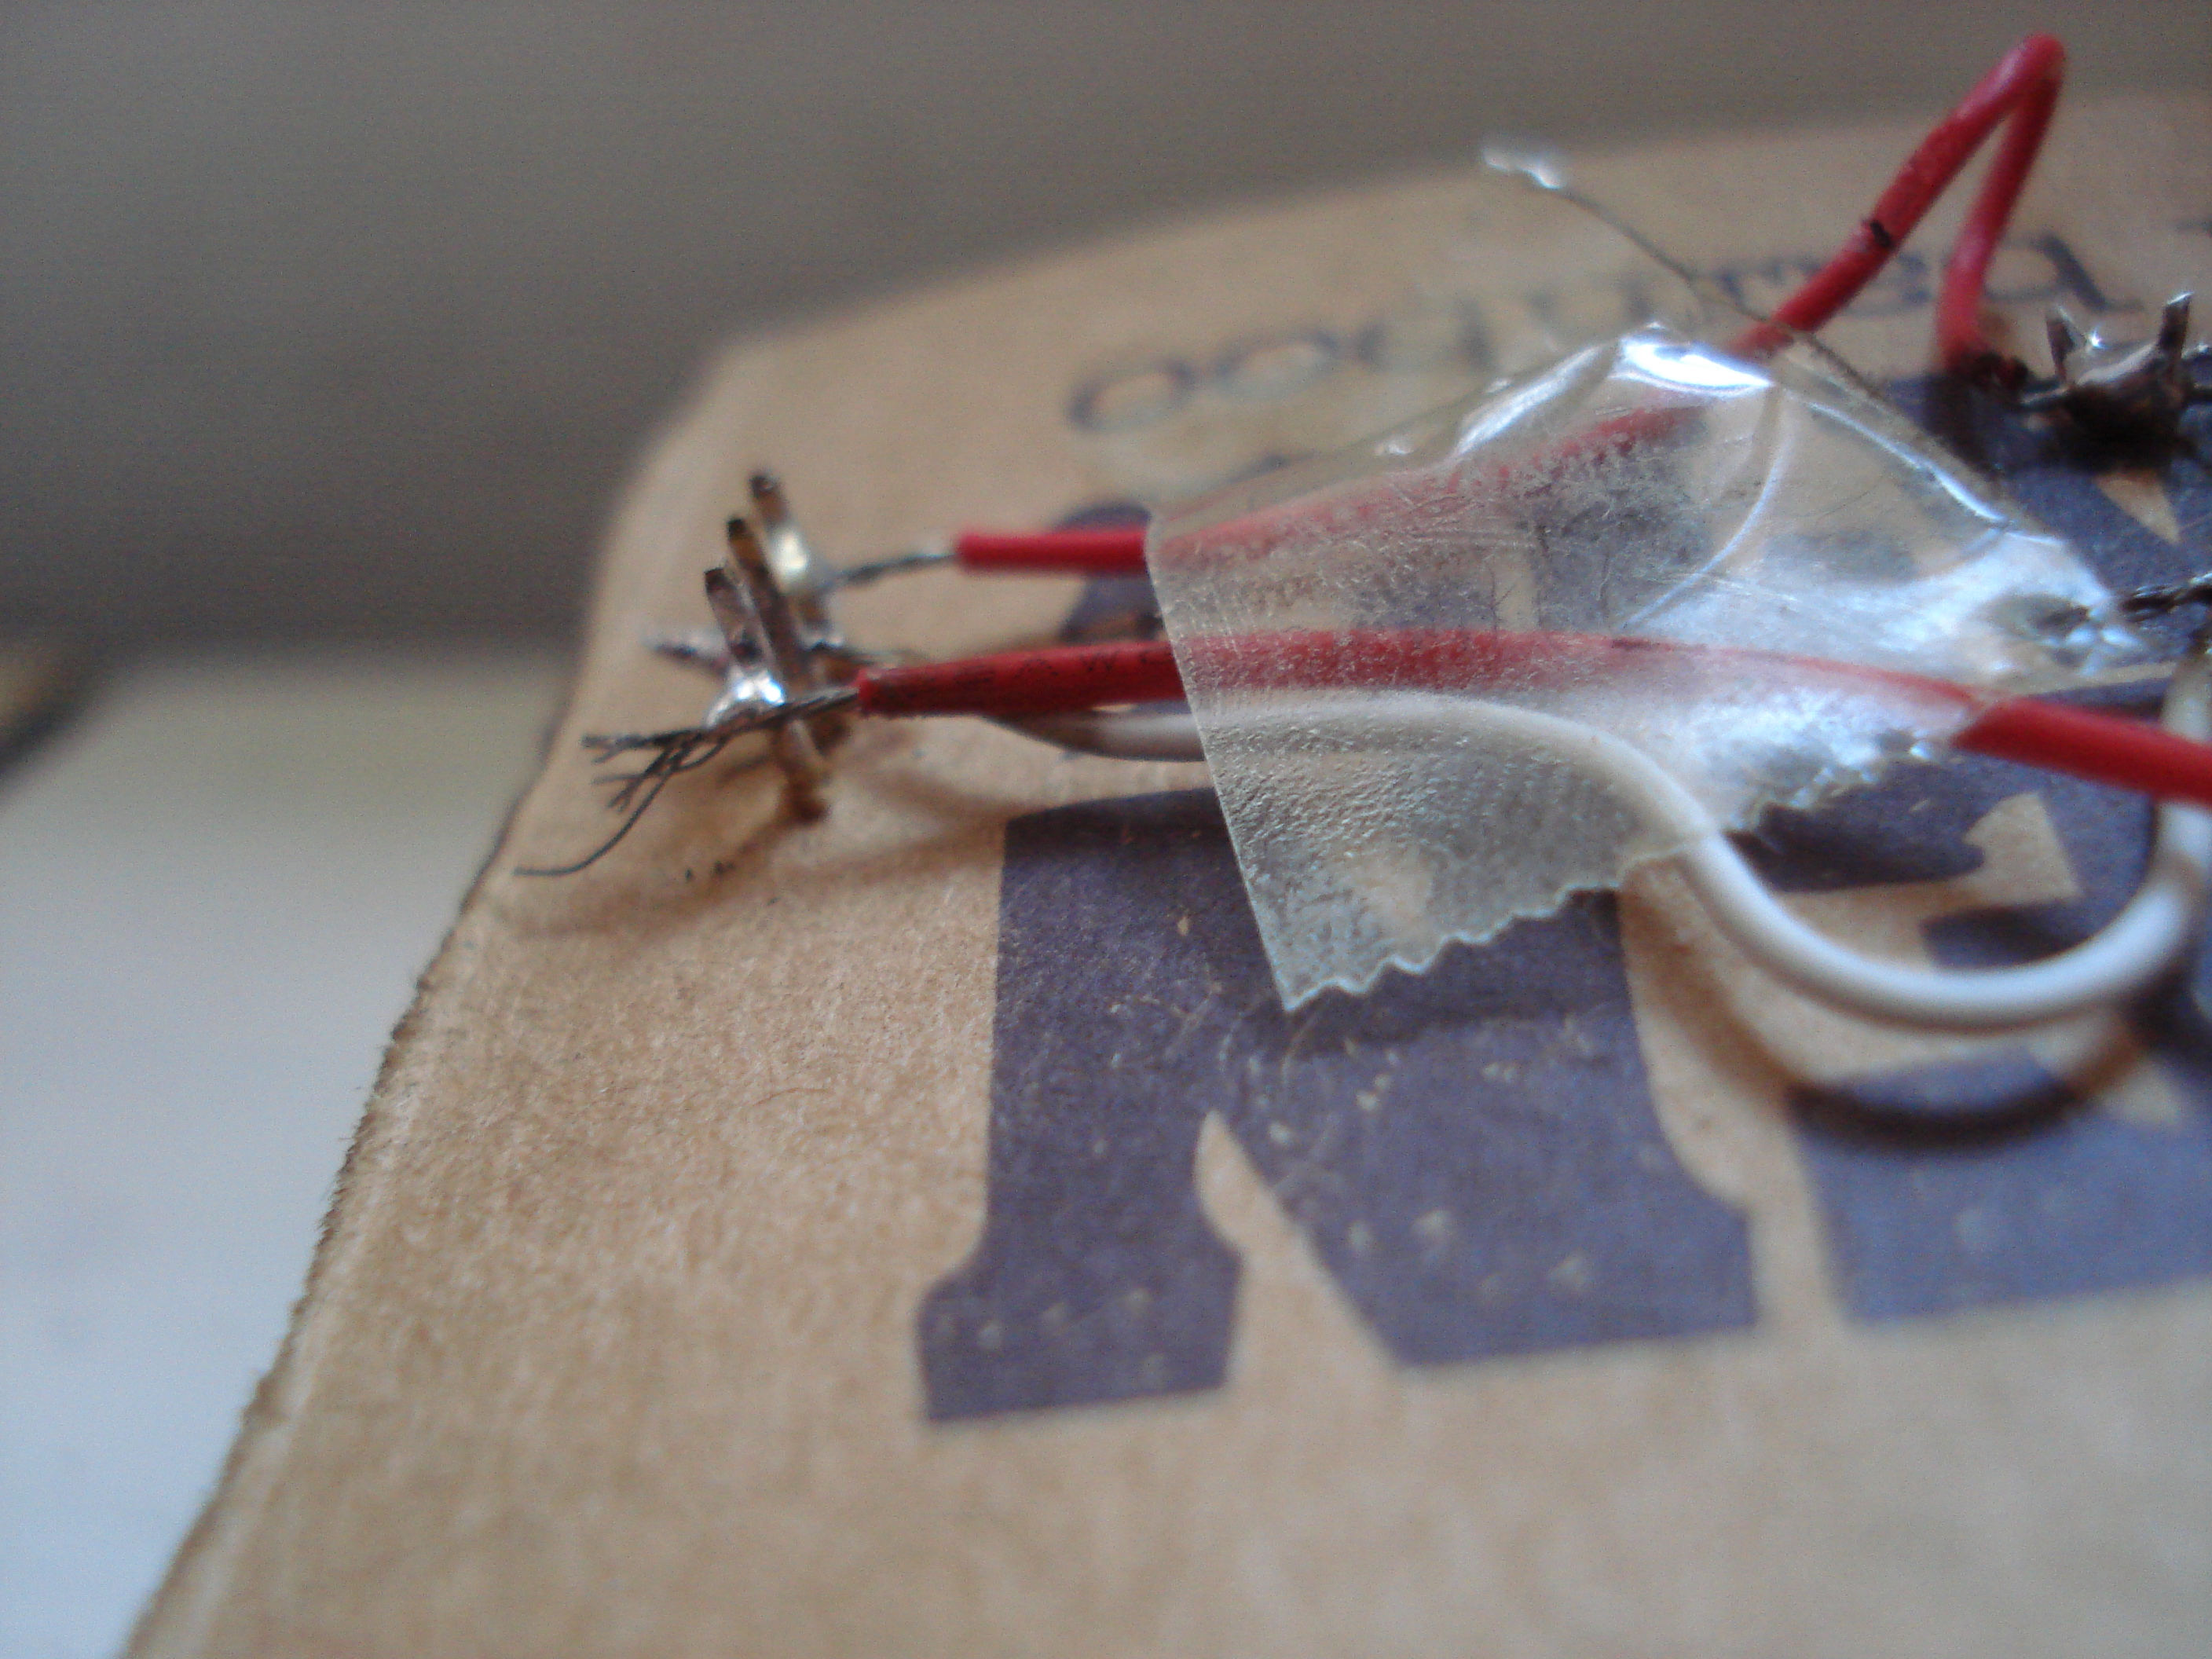 the DHT11 soldered(2)
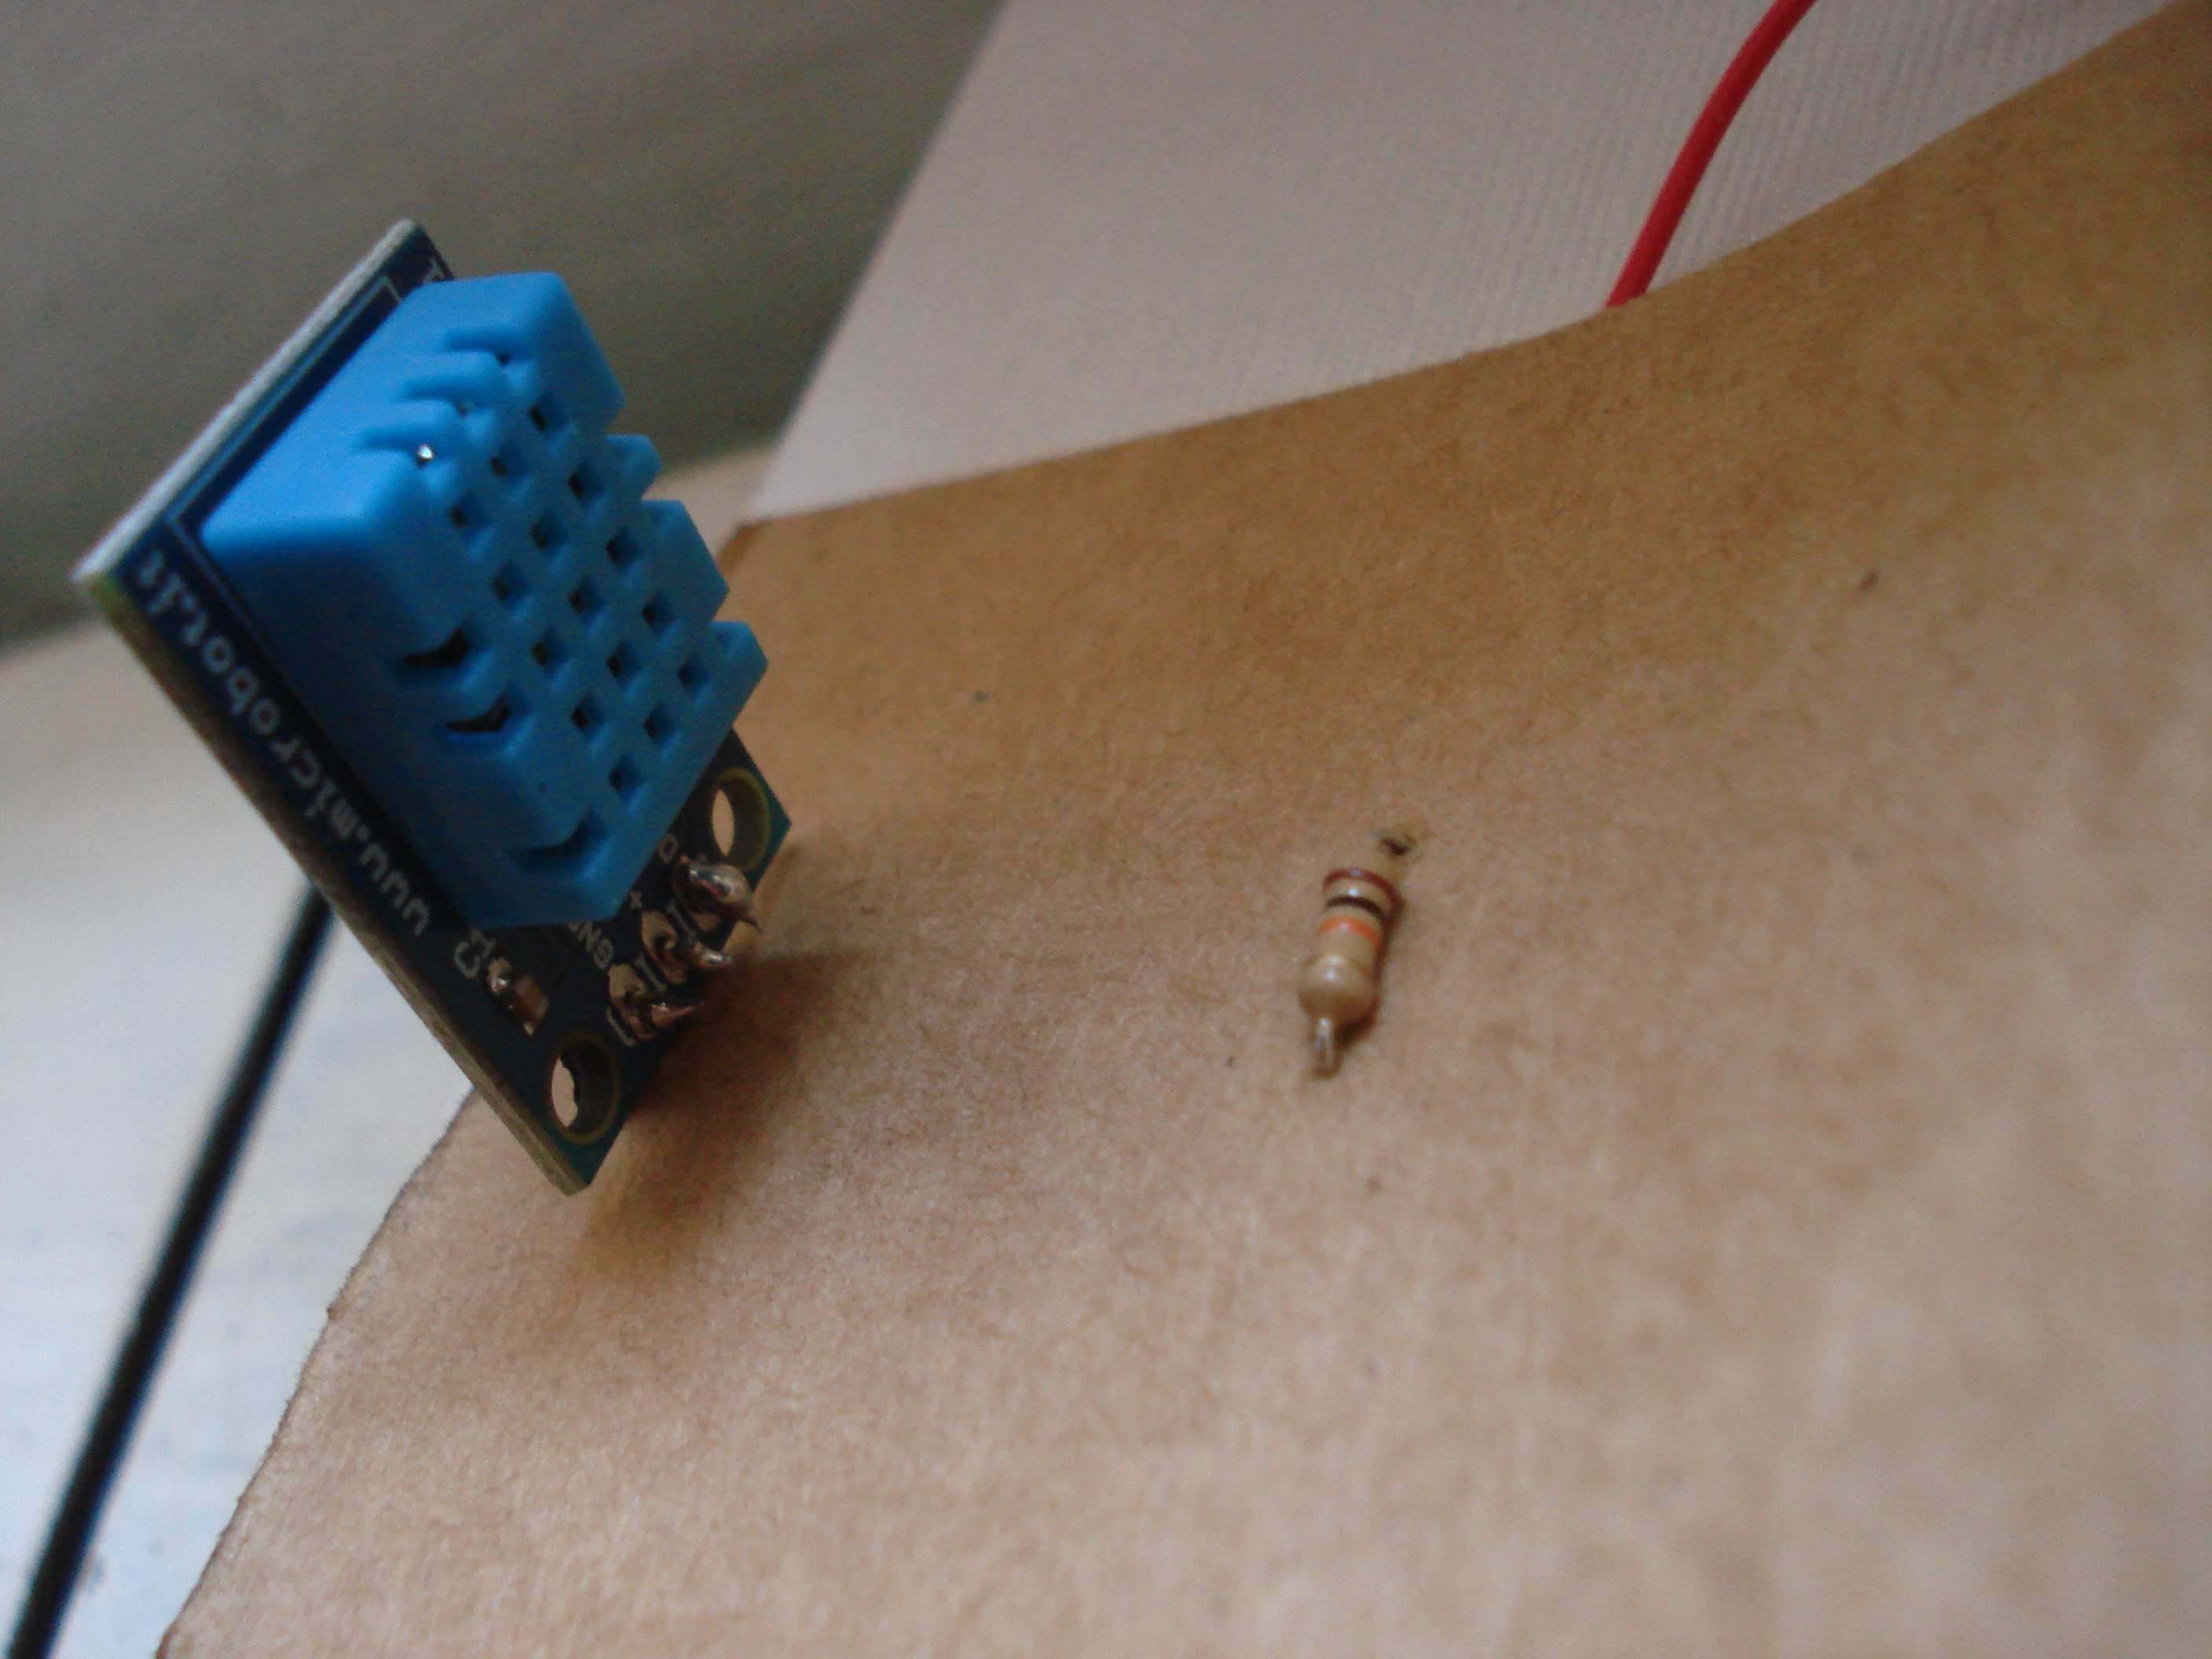 The DHT11 soldered (3)
 The prototype
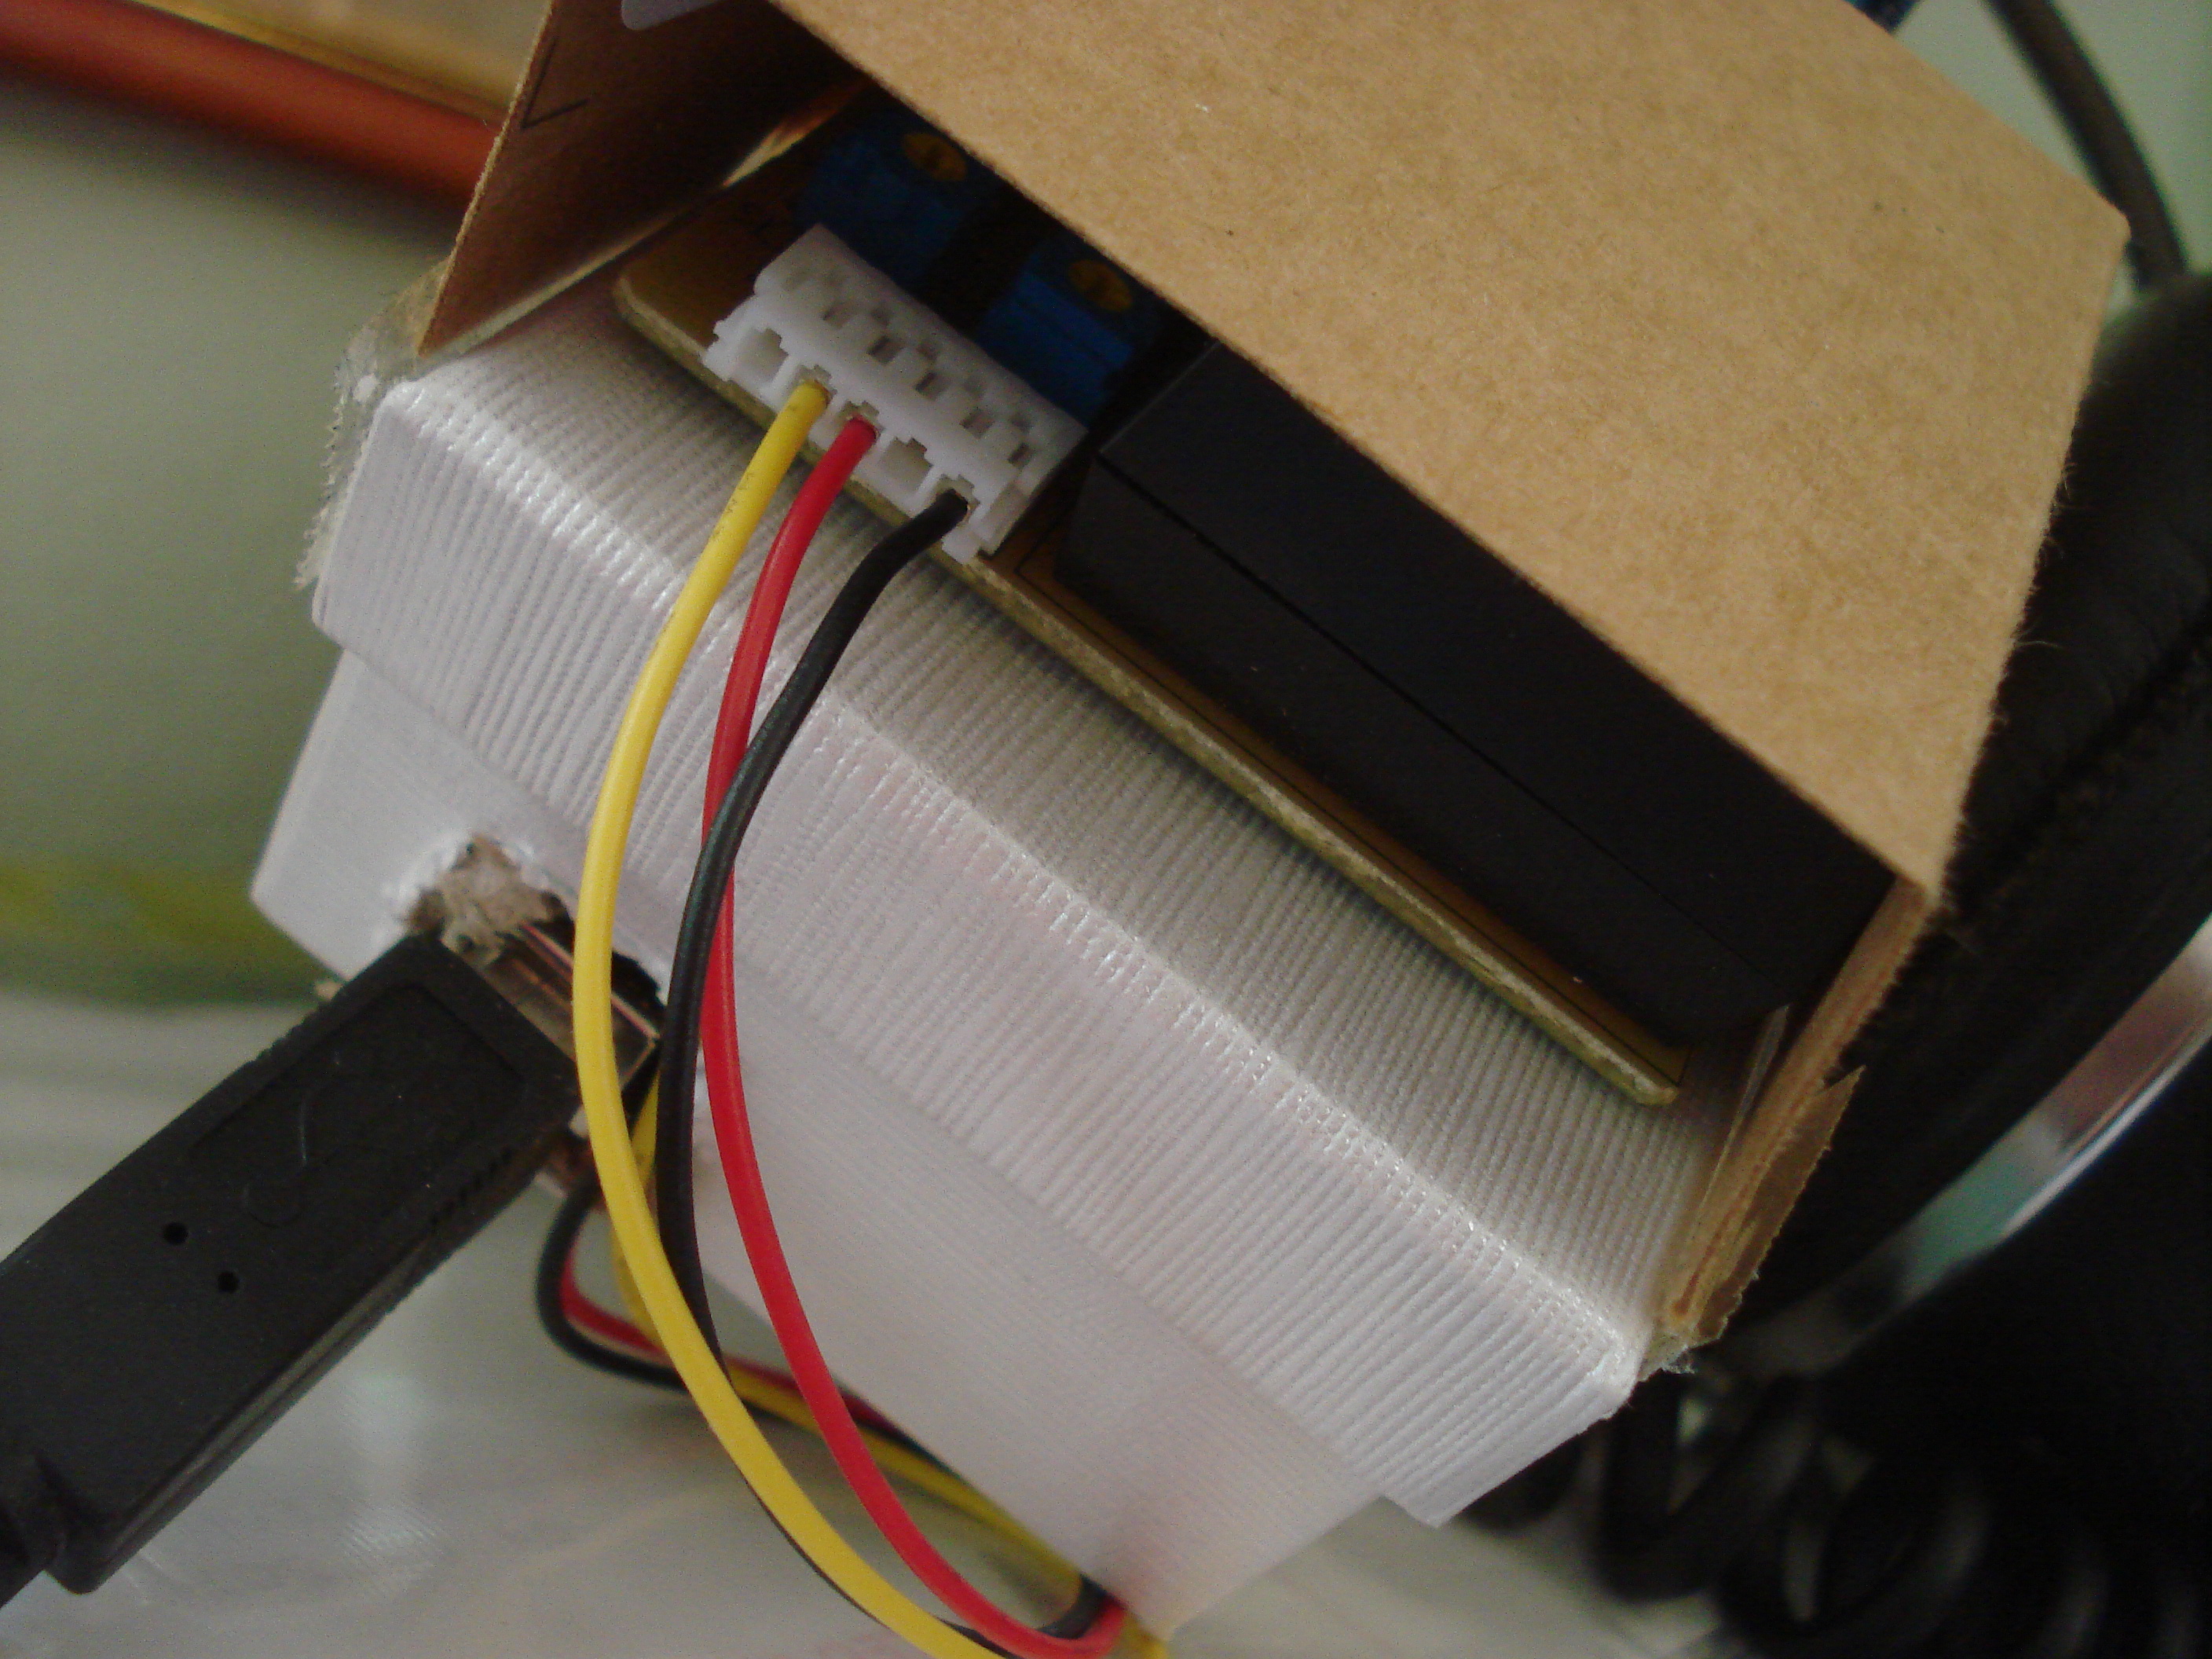 The prototype and the dust sensor covered
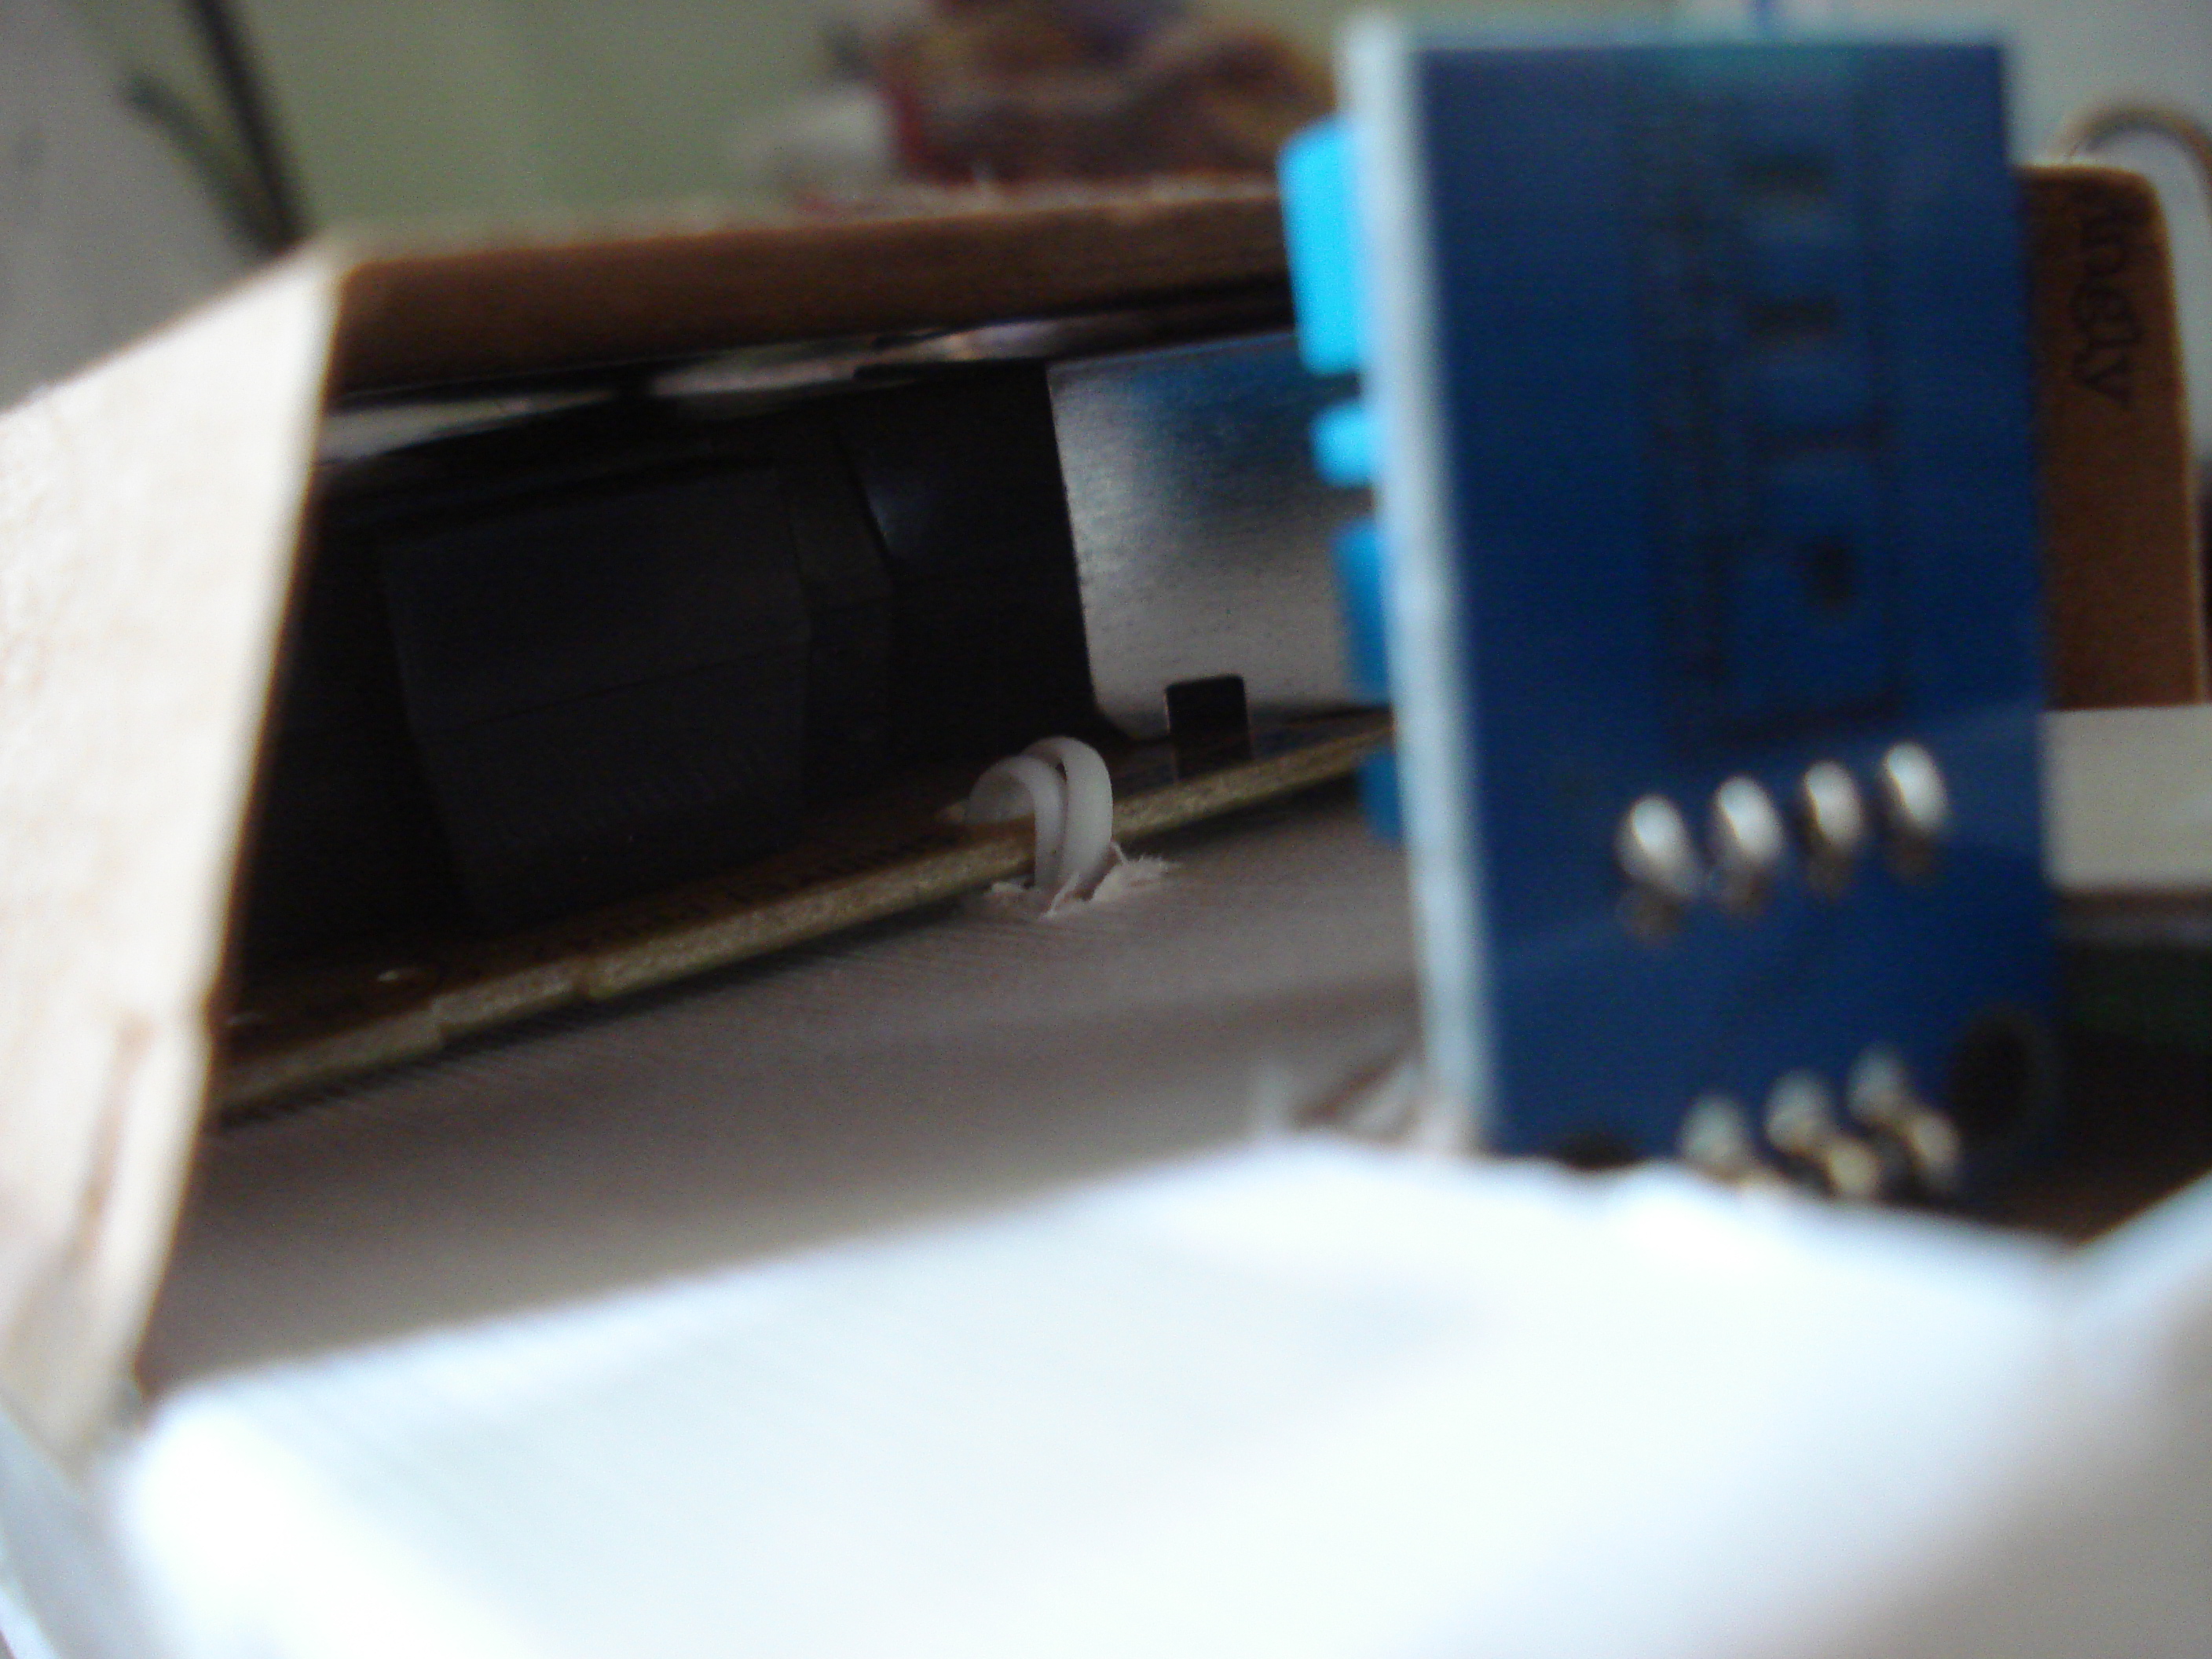 The prototype and the dust sensor covered(2)
Tests
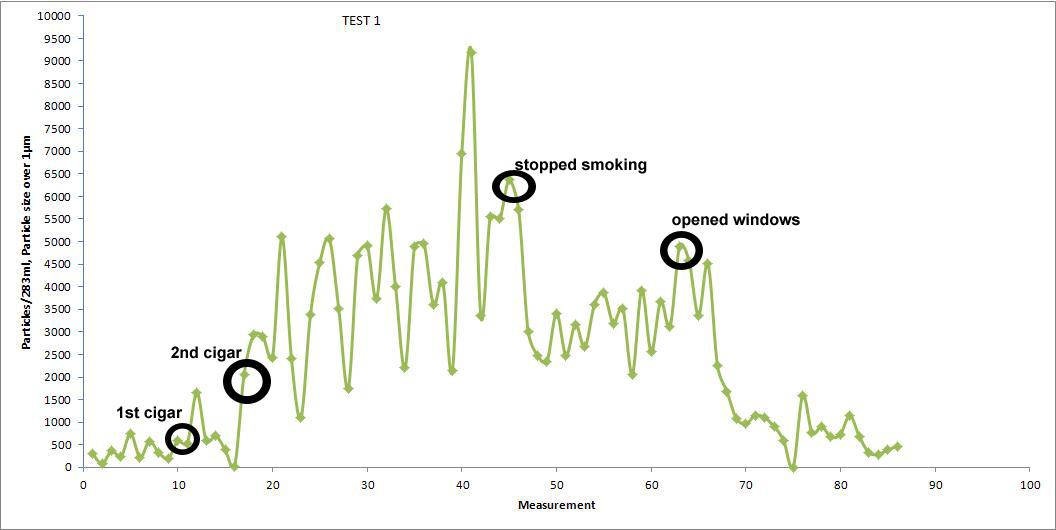
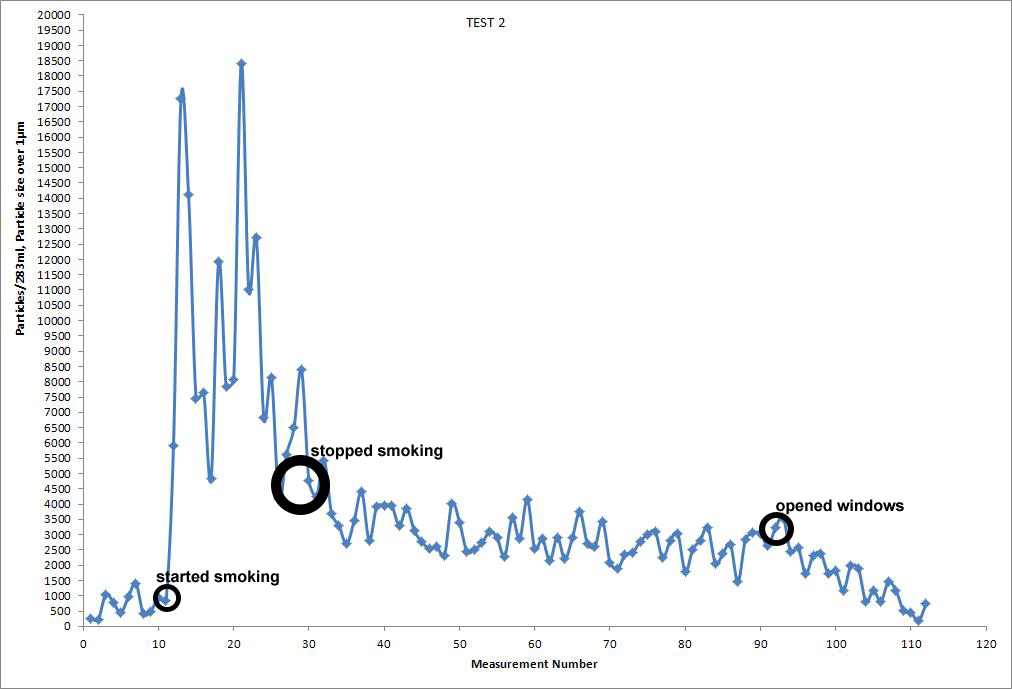
Two simple and short period tests took place in a room with people smoking. The test started with no smoke in the air. After a short period of time people in the room started smoking. After some time and cigars were burned out, windows opened so air could be refreshed. All the differences in particles’ concentration in the air were recorded. The main idea was to capture the trends in the concentration (and to see if this could be achieved with the sensor) and not to measure particles with accuracy. Charts below show the concentration of particles per 283ml of air and measurements were taken every 30 seconds.
The TEST1 was made with Dust Sensor covered from the frond side so the air flow was from the bottom to top. In the TEST2 the sensor was uncovered. The differences in the two measurements may be due to this fact. Also the wavy form of measurements in each test, from measurement to measurement were can be found differences up to 10000 particles from one measurement to another may be caused due to air fluctuations or/and the sensor itself.
The code used in this project was a combination of the code provided by the sites that selling the sensors. The code is the one below and it takes a measurement every 30 seconds:
[sourcecode language=”c”]
#include <dht.h>
#define dht_dpin A0 //no ; here. Set equal to channel sensor is on
dht DHT;
int pin = 4;
unsigned long duration;
unsigned long starttime;
unsigned long sampletime_ms = 30000;//sample 30s ;
unsigned long lowpulseoccupancy = 0;
float ratio = 0;
float concentration = 0;
void setup() {
Serial.begin(9600);
pinMode(4,INPUT);
starttime = millis();//get the current time;
Serial.println("Concentration,Humidity%,Temp C");
}
void loop() {
DHT.read11(dht_dpin);
duration = pulseIn(pin, LOW);
lowpulseoccupancy = lowpulseoccupancy+duration;
if ((millis()-starttime) > sampletime_ms)//if the sampel time == 30s
{
ratio = lowpulseoccupancy/(sampletime_ms*10.0); // Integer percentage 0=>100
concentration = 1.1*pow(ratio,3)-3.8*pow(ratio,2)+520*ratio+0.62; // using spec sheet curve
Serial.print(concentration);
Serial.print(",");
Serial.print(DHT.humidity);
Serial.print(",");
Serial.println(DHT.temperature);
lowpulseoccupancy = 0;
starttime = millis();
}
}
[/sourcecode]
What must be done in the future
Here it has to be said that the sensors were not calibrated. In this project the calibration was not so essential because only the sensitivity of the sensor was to be measured and not the accuracy. In a future project the sensor should be calibrated in order to measure its accuracy. In many sites are found projects that give the sensor’s measurements in μg/m3. A well known project is Air Quality Test Box in the site instructables [15]. It is a very well-constructed and developed project but it is almost sure that the programmer didn’t calibrate the sensor (it is not said anywhere how it was calibrated in order to measure in μg/m3). Another point is that this sensor doesn’t measure PM1 neither PM2.5 nor PM10. PM1, PM2.5 or PM10 are different things than saying the sensor can measure particles with diameter 1μm and above [16]. Maybe PM can be shown with the Sharp sensor because it has a chart that someone can convert the measurements to μg/m3 (with huge error) [12] but not with the Shiney’s.
Another idea is to add and other sensors like CO2, NO2 etc. Also an SD card and battery power supply can be added in order to let the sensors record measurements without being connected to a PC. Moreover, there can be planted many sensors in an urban area with wireless internet connection (or mobile phone connection) so we can have real time spatial air pollution data.
Conclusion
The Shiney’s dust sensor showed that can detect the differences of the concentration of PM in the air but more tests should be done, calibration of the sensor and/or tests side by side with another reliable sensor so the Shiney could be compared. DHT11 is a reliable sensor to measure relative humidity and temperature.
References
[1] Health Effects Institute, (2010). Panel on the Health Effects of Traffic-Related Air Pollution. Traffic-Related Air Pollution: a Critical Review of the Literature on Emissions, Exposure, and Health Effects Special Report 17. Available at: http://pubs.healtheffects.org/view.php?id=334 [July 2013].
[2] Zhang K., Batterman S., (2013). Air pollution and health risks due to vehicle traffic, Science of the Total Environment, pp: 450–451.
[3] World Health Organization, (2010). Air quality and health. Fact sheet No 313, updated September 2011. Available at http://www.who.int/mediacentre/factsheets/fs313/en/ [July 2013].
[4] Han X., Naeher L.P., (2006). A review of traffic-related air pollution exposure assessment studies in the developing world, Environment International 32, pp: 106 – 120.
[5] http://en.wikipedia.org/wiki/Arduino
[6] Dust Sensor used, http://www.shinyei.co.jp/stc/optical/main_ppd42ns_e.html
[7] Temperature-humidity sensor, https://learn.adafruit.com/dht/connecting-to-a-dhtxx-sensor
[8] DHT11 sensor, droboticsonline.com, DHT11Humidity & Temperature Sensor, Available at http://www.micro4you.com/files/sensor/DHT11.pdf [April 2014]
[9] http://www.shinyei.co.jp/stc/optical/main_dust_e.html
[10] Tracy Allen, (2013), De-construction of the Shinyei PPD42NS dust sensor, EME Systems LLC. Available at http://takingspace.org/wp-content/uploads/ShinyeiPPD42NS_Deconstruction_TracyAllen.pdf [April 2014]
[11] Sharp Optical Dust Sensor, http://sharp-world.com/products/device/lineup/data/pdf/datasheet/gp2y1010au_e.pdf
[12] David Gironi’s optical dust meter, http://davidegironi.blogspot.gr/2013/08/an-optical-dust-meter-that-uses.html
[13] Chris Nafis, Air Quality Monitoring, http://www.howmuchsnow.com/arduino/airquality/
[14] Seinfeld H. John, Pandis N. Spyros, Atmospheric chemistry and physics, From air
pollution to climate change, John Wiley & Sons, INC., second edition, 2006.
[15] Air Quality Test Box, http://www.instructables.com/id/Air-Quality-Test-Box/
[16] http://www.airquality.utah.gov/clean_air/archive/particulate_matter.htm
[17] Hussein T., Puustinen A., Aalto P. P., Makela J. M., Hameri K., Kulmala M, (2004). Atmospheric Chemistry and Physics, 4, pp. 391 – 411. Available at http://www.atmos-chem-phys.net/4/391/2004/acp-4-391-2004.pdf [April 2014]

Comments
4 responses to “Air Quality Project (ver. 1)”
This is brilliant
Thank you Ron!
Thank you for all of the informations,
I made a same project. I came across the same problem so
if you need the concentration in mg/m3
instead of
concentration = 1.1*pow(ratio,3)-3.8*pow(ratio,2)+520*ratio+0.62;
you can use
concentration =(ratio+0.16)/9.6; //it gives mg/m3 . (not ug/m3)
it is a simplyfied equation because the sensor has not so much accuracy.
Best regards,
Nikos
Thank you very much Nikos.
I will come to this project again when there’s going to be enough spare time for me, to get in touch with arduino again and I will use your equation. I will be in touch with you then.
Kind regards,
Antonis